Background
Ever have denormalized data in Excel that you've made into a pivot so you can see what the data looks as a hierarchy? Ever want to put that data into Microsoft Project so you can manage that structure as tasks? I did today and figured out how today it. What follows are the steps.
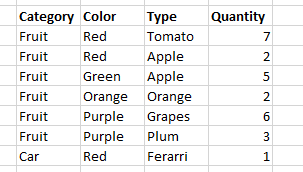 |
| The original, denormalized data used as the data source of the Pivot Table. |
Steps
In order to get your denormalized data as a hierarchy into Microsoft Project, follow these steps:
1. Create a pivot table
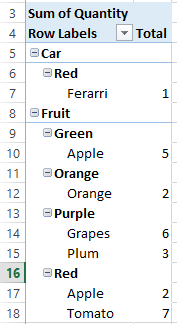 |
| The standard pivot table in Excel. |
2. Put the pivot table in "outline" mode
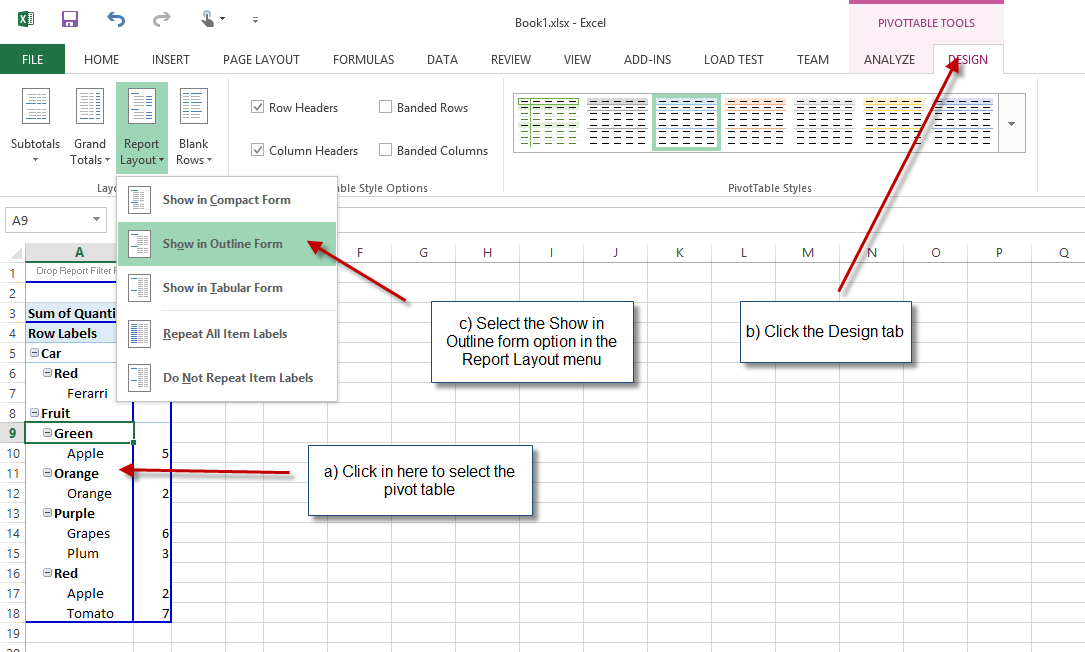 |
| Displaying the pivot table in Outline format. |
3. Paste the dimensional hierarchy data into MS Word
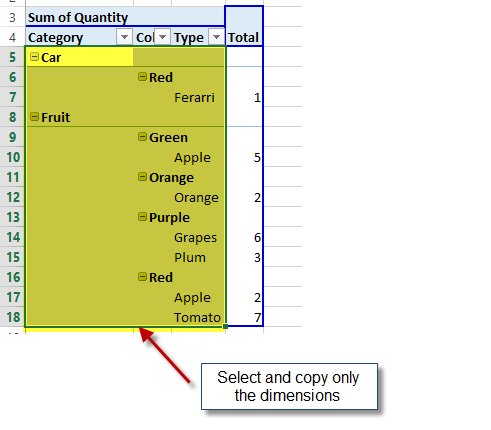 |
| Selecting and copying only the dimensional (grouping/category data) for pasting into Word. |
4. Paste the data from Word into MS Project
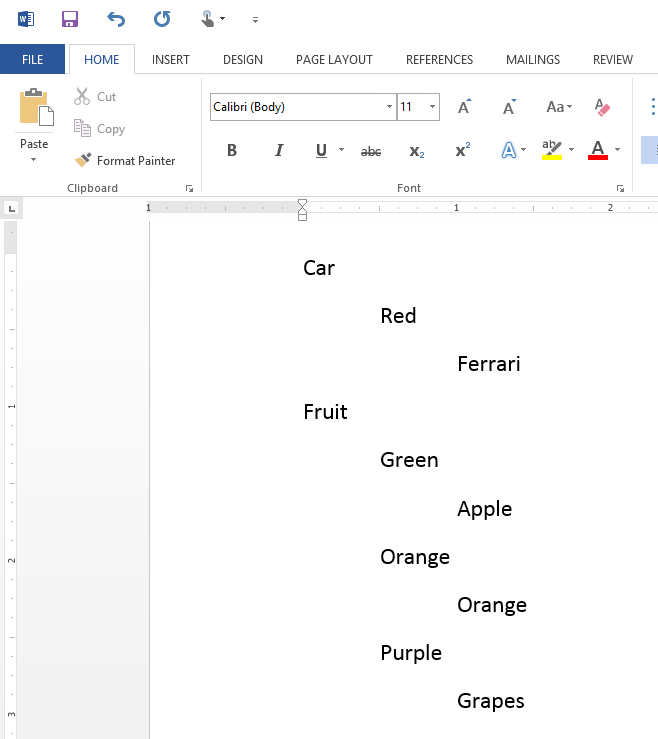 |
| The dimensional data pasted into Word. |
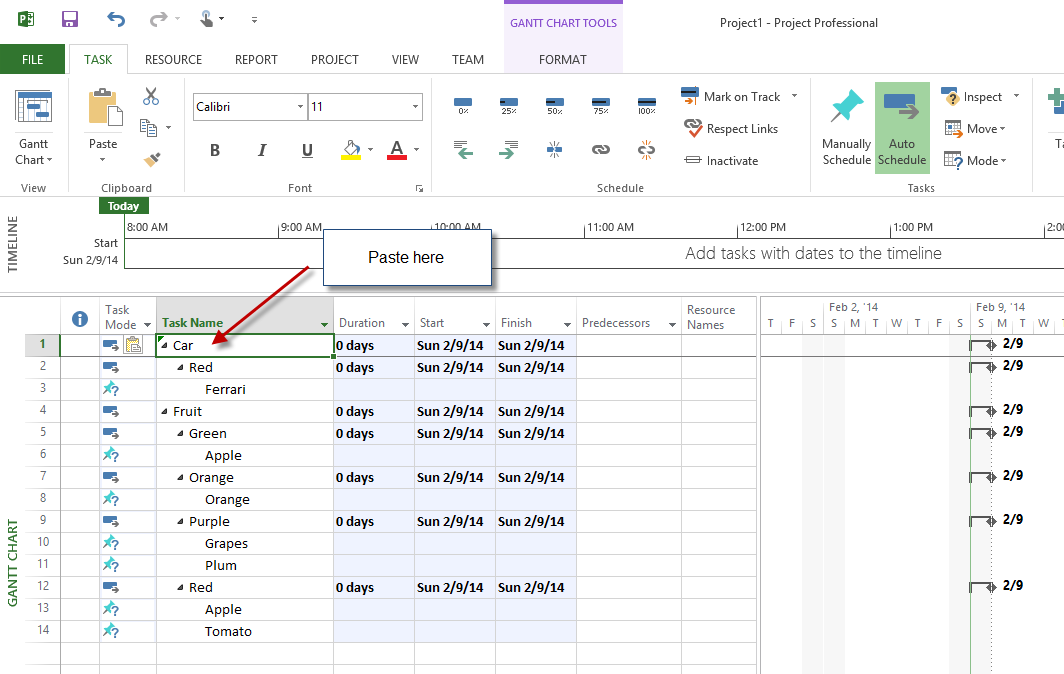 |
| The dimensional data pasted from Word into MS Project. |
Milestone: You have your hierarchy but still need the data
5. Paste the measure (numerical) data from Excel into MS Project
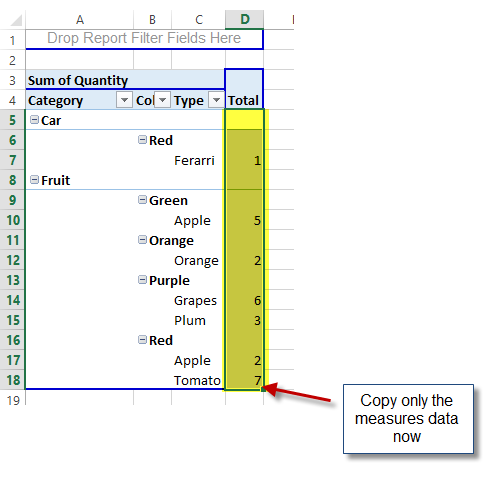 |
| Selecting and copying only the numerical totals (measures) data for pasting into MS Project. |
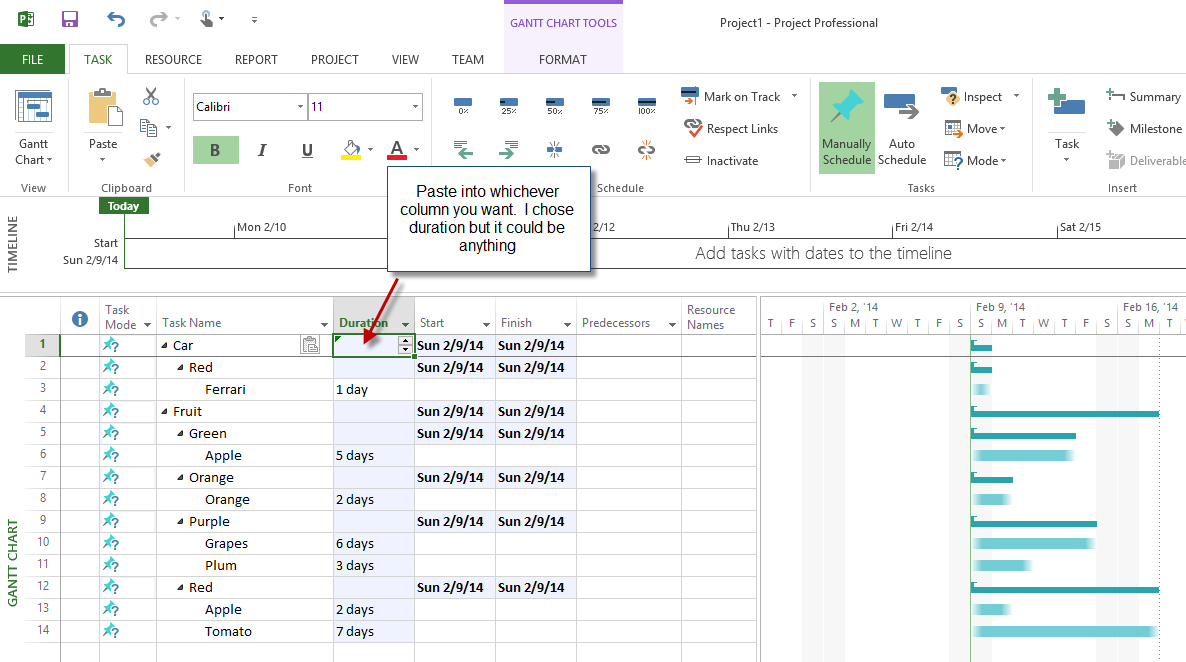 |
| Pasting the measures data into MS Project. |
You're done!
Enjoy!